COMPENSATION TRACKER
Every day, mobile technology users generate mountains of data, from the links they click and the social media posts they like to their location and online behavior information. This data is gathered and sold by large, global companies but users aren’t compensated for their “labor,” or the data they produce. As the capabilities of AI inch closer to replacing jobs held by humans, it will become more important than ever to address the loss in income many workers of the future will experience. Fair compensation of data production is one way to address this oncoming disparity. This project imagines a system that would give users insight into the volume, type, and value of the data they produce to build awareness of the compensation they’re currently not receiving.
Tools
Photoshop, XD
My Roles
Project Manager, Lead UX Designer
Design Process
To address this project, I lead a team in a three-part design process consisting of investigative efforts on three fronts: conceptual, technical and empirical.
Conceptual Investigation
65% of the overall design process was dedicated to the conceptual investigation given the problem the team was trying to solve required an understanding of the higher-level, theoretical concepts of “Data as labor”.
The team analyzed both the direct and indirect stakeholders as well as their values and potential values and considered possible value tensions and potential social, economic, and political concerns that come with designing a product like this.
We defined our direct stakeholders as users and OS manufacturers. Users are the everyday people from the general public who use a smartphone and our work suggested that in this context, their core values would be convenience, time, security, control and privacy. These values form what I called a “tension web,” as each is at odds with the other to a certain degree. Secondary values, or values users may not be explicitly aware they possess, would include information and transparency.
OS Manufacturers, the second direct stakeholders, are the technology companies who provide the OS platforms for data collection, such as Apple (iOS) and Google (Android). Their primary values include reputation, loyalty and profit, which themselves form a second “tension web” but the value of profit we suggest is also at odds with all of the user values.
Indirect stakeholders we considered the companies and organization that are actively tracking and selling personal data. We identified the values of these third-party companies as information, access, and insights. Since most of their profit is determined by how they can obtain and analyze the data, accessibility to data is valuable for companies and organizations.
Technical Investigation
Our technical investigation of this space focused on understanding the constraints necessary to explore the notion of Data as Labor in a meaningful way. Ideally, a real-world implementation of this concept would consider all forms of data production, from what we produce through our phones and computers to information gleaned from driving or TV viewing habits, what foods we order from restaurants, what books we read, and so on. That was beyond the scope of this project, so we chose to focus on mobile activity, arguably the richest medium of data production.
We investigated individual existing applications and organizations that already exist in this space but found they were generally focused on providing a marketplace or method for the sale. We wanted to create an informative application that shed light on the data produced and its value. For that, we took our inspiration from another informative application, Apple’s iOS-native Screen Time app.
Screen Time gives iOS users insight into how they are spending their time on the iPhones. It collects and compiles time-based usage data for all the apps a user engages with on the devices and provides reports that can create awareness and drive habit change. We felt this model closely matched our goals and so adopted the look and feel of this application. Our vision is that our application would be a native part of iOS, just as Screen Time is.
Determining the actual value of personal data proved more difficult. There is no real consensus as to how much any particular piece of data is worth. This is due primarily in part to the fact that marketplace attempts live outside of the larger data collection machines like Facebook and Google and thus don’t have access to the scale and partnerships, or equal playing field, required to arrive at actual market values. As such, we used arbitrary values in our prototype, but we did settle on four unique categories of data production; behavioral, demographic, location, and browsing data.
Prototype
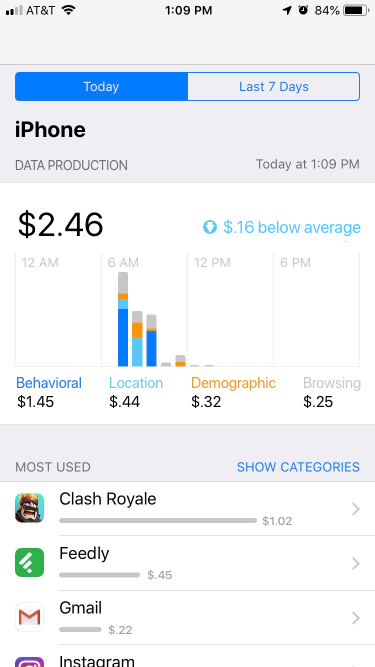
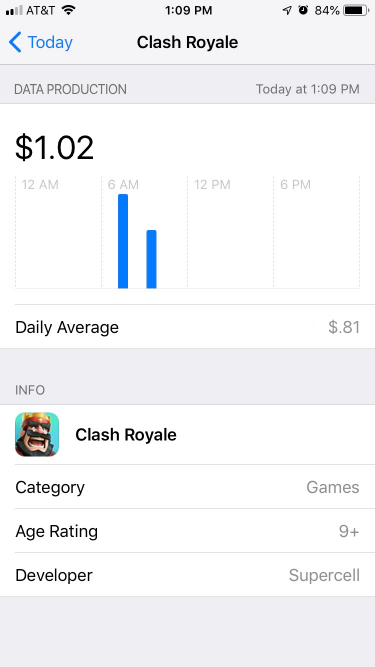
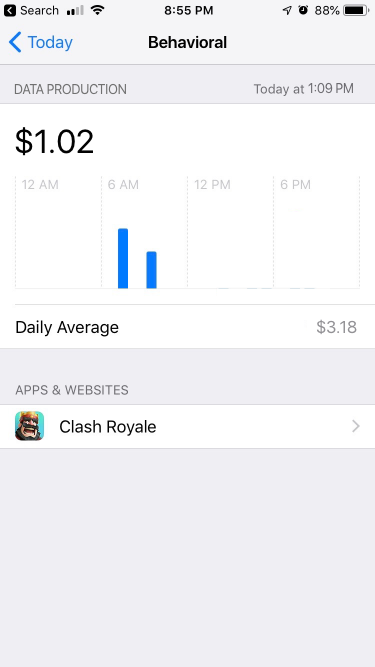
Based on our technical investigation, I drafted a simple, initial prototype of the application. This prototype uses the current iOS application Screen Time as a template and demonstrates a method for informing users of potential data production-based earnings across their smartphone application usage. Four data types are tracked:
1. Behavioral, or data concerned with app usage such as when it was opened, closed, duration of use, etc.
2. Demographic, or data concerning any information that reveals personally identifiable information like race, gender, ethnicity, income level, etc.
3. Location, or data that reveals perhaps where a user is currently, where they were when they used the application, etc.
4. Browsing, or data that illuminates a users online habits, such as sites they visit, how long they visit them, general content interests, etc.


Empirical Investigation
For the empirical investigation, we interviewed smartphone users. We were interested in learning how much they were aware of the type of data they produce and what they valued the most. We were able to identify that our interviewees’ awareness of the data they produce varied across a large scale. Some were more aware that the data collected is more than just the pictures you post on social media and one believed only some of the content they produce online is valuable. Interviewee’s were aware of particular data collected by companies included: fingerprint data, customer profiles, name/emails, and cursor movements.
It was clear that all of our interviewees felt they had little to no control over the data they produce online, and many mentioned there seem to be no choice but to allow the sites to track them in order to use the site. They believe that the only way to gain control over their data is to limit their activity online. One interviewee stated that “I think the only way I could control how my data is used is by not using the internet at all and not producing any data to begin with”. Another interviewee even mentioned they had stopped using certain sites, such as Facebook, completely because they felt they had no control over the way their data was being used and what it was being used for.
With our user testing we were able to gain an understanding of what our potential stakeholders thought of our design. One interviewee like the layout of the design, mentioning that it was easy to follow visually but was confused as to what each category represented. She then recommended the application have more description about what type of data falls under each category. The interviewee also mentioned that the price below average on the right side of the design was a bit confusing and wondered if it was necessary. Overall the interviewees thought it was a clean design that was easy to understand and believed it to be user friendly.
Insights
One major finding the team was able to gain from this project was the understanding that many people remain unaware of the value they provide to companies through their online usage. During the initial user interview phase, all six online users that participated stated they were aware their online activity was tracked; however, many had not considered that their activity might have a clearly calculable monetary value. One user even humorously stated that “I doubt anyone would pay to see how many times I check my ex’s Facebook.” While this sort of online activity may appear worthless to users, companies (specifically advertising companies) may benefit from it greatly. This finding demonstrated to the team that transitioning the data compensation tracker to become an educational and informative tool rather than a marketplace was a valuable and relevant decision. To promote support for the concept of “data as labor,” the team needed to first devise a way to allow users to become informed.
Similarly, by devising an informative tool, the team was able to address the sentiment that data tracking was the “price” users must accept when using the internet. One user even described how accepting a lack of control over the data they produce is so normalized that they’ve learned to not question it when they stated “It just seems sort of normal because everyone I know has the same thing happen to them and you don’t always see where your data is going or what it’s being used for to really care about it.” The team believes that by integrating the data compensation tracker into existing systems, users will (because of becoming informed) gradually learn to question their acceptance of having no control over their data and create a paradigm shift, which has the long-term potential to generate change.
Overall, the team was able to glean valuable insight regarding strategies for informing online users of the types and potential value of the data they produce online. Further wide scale awareness of how data is sold and gathered is needed in order to spark change, and an embedded data compensation tracker may be the first step in providing that awareness.